
Managing your transport activity: 5 indicators to monitor every week

The Management of transport activity is not limited to organizing tours: it's about following them, adjusting them, and improving them week after week. To do this, good instincts are not enough — concrete reference points are needed.
Follow a few key indicators on a regular basis makes it possible to detect delays, control costs and improve customer satisfaction, without drowning in complex dashboards.
In this article you will find 5 simple and essential KPIs to be monitored every week to keep a clear vision of your logistics and to make the right decisions at the right time.
Why monitor indicators every week?
Track your logistics indicators Once a month is often too late. On the other hand, a quick weekly update allows you to Identify drifts, to react without delay and toadjust your tours proactively.
React quickly in case of problems
A repeated delay, an underused vehicle, a tour that costs more than expected... These are weak signals. If you detect them quickly, you can correct the situation as early as the following week.
Anticipate rather than suffer
One good management of transport activities is based on regularity. By following a few indicators each week, you can identify trends and avoid unpleasant surprises at the end of the month.
Maintaining a good level of customer service
On-time deliveries, smooth routes, better communication... The more up to date your indicators are, the more you can guarantee reliable service — and reassure your customers.
Gain peace of mind
By relying on reliable and up-to-date data, you can make decisions with greater clarity. No need to “feel” how the activity is going: you can see it.
Effective management does not require hours of analysis, but a good weekly routine. The most important thing? Know what indicators to look for — and that's what we're going to see right after.

Transport activity management: the 5 KPIs to monitor
You don't need dozens of charts to stay in control. Here are the 5 indicators you can track every week to improve your routes, control your costs and keep your customers happy.
Indicator 1: the on-time delivery rate
What's the point?
Measures the proportion of deliveries made within the planned time frame. A good rate reflects a fluid and reliable organization.
Why follow him?
It is a direct indicator of customer satisfaction. Below 90%, there is often a problem of foresight or a poorly distributed load.
Indicator 2: kilometers traveled vs optimized kilometers
What's the point?
Compare the kilometers actually covered with those planned or theoretically optimal.
Why follow him?
This makes it possible to identify detours, empty routes or poorly scheduled routes. To be corrected to reduce costs.
Indicator 3: the average cost per tour or per delivery
What's the point?
Calculate the overall cost of a tour (fuel, driver time, vehicle depreciation), in relation to the number of deliveries made.
Why follow him?
A good indicator of profitability. A sudden surge may signal an imbalance or a recurring problem that needs to be addressed.
Indicator 4: the rate of occupancy or use of vehicles
What's the point?
Measure how much the capacity of each vehicle is used (in volume or number of deliveries).
Why follow him?
A low rate indicates partially empty trucks: this is often a sign that a grouping or better organization is possible.
Indicator 5: the number of incidents or anomalies
What's the point?
List the problems encountered in the field: impossible access, customer absence, returned packages, etc.
Why follow him?
It's not just a number: it's a mine of information to adjust routes, improve communication with customers, and train teams.
These five indicators, taken together, offer a clear, rapid and actionable vision of transport activity. And above all: they can be followed without spending too much time on it..

How do you collect this data without spending the day there?
Follow your indicators every week, it's useful — but it still has to be simple. The objective is not to create a new administrative burden, but to automate as much as possible and to streamline the feedback of information.
Centralize your data in a single tool
Avoid scattered files: create a shared table or use software that groups planning, trips, costs, and incidents all in one place. The ideal is a clear dashboard that can be read at a glance.
Rely on transport management software (TMS)
A TMS allows you to automatically generate indicators based on the data you're already using to plan. No double entry, no calculation to do by hand. Everything is centralized and updated in real time.
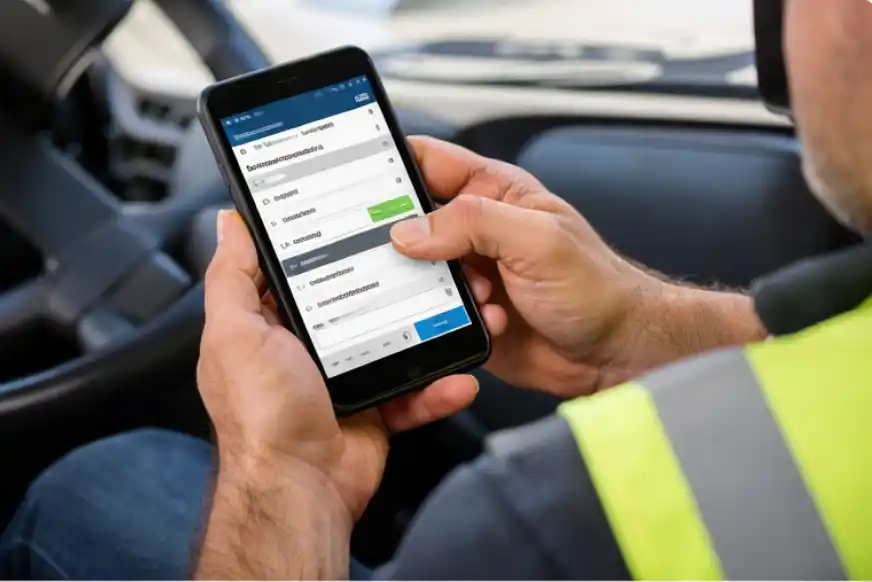
Involve drivers in field monitoring
An incident that has occurred? Postponed delivery? By giving drivers a simple tool (mobile application, form, internal messaging), you facilitate the transmission of information without multiplying calls.
Automate key metrics
Whenever possible, use formulas or automation features (via your software or an intelligent spreadsheet). This allows you to visualize trends without having to reprocess data every week.
Once the system is in place, follow-up only takes a few minutes. What matters is consistency... and the ability to take action when an indicator sounds the alarm.
Good management is also a good tool
Even with rigor and a good method, it is difficult to manage your transport activity blindly. To track your indicators without spending hours on them, the tool you use makes all the difference.
A clear dashboard, accessible in real time
A transport management software (TMS) such as FasterDelivery makes it possible to visualize all the key data: punctuality rate, kilometers traveled, occupancy rate, ground anomalies... All updated automatically.
Less typing, more decisions
A good tool avoids double tasks. It retrieves information as it happens — during planning, monitoring tours, or via field feedback — and transforms it into Transport indicators directly usable.
A gain in reactivity
When a KPI exceeds a threshold (high delay rate, unprofitable tours...), you see it right away. This allows you to adjust as early as the following week, without waiting to “take stock” at the end of the month.
Better coordination between teams
The software is becoming a common medium: everyone can consult useful information, raise an alert or monitor progress. This limits oversights, tensions... and extended meetings.
Manage your transport activity effectively does not rely on complex reports, but on a simple, well-configured tool that is really useful on a daily basis.
In summary: a good management of the transport activity does not rely on instinct or on monthly reports that are too cumbersome to exploit. It is the small regular, well-targeted follow-ups that make it possible to adjust, optimize and maintain smooth logistics.
With 5 well-chosen indicators, you can quickly identify what's working, what's going wrong, and what needs to be improved. All without turning your week into an Excel marathon.
And if you use a tool like FasterDelivery to centralize your data, visualize your routes and track your KPIs automatically, you not only save time... but also real peace of mind.